 NexIP官方博客
Around mid-July, residential proxy detection capabilities suddenly became accessible to everyone. A major IP intelligence service opened its residential proxy identification dataset, previously limited to enterprise contracts, into a self-service API. Coverage surged from approximately 47 million a year ago to over 107 million directly observed IPs—a 2.3x increase—spanning 126 providers. Around the same time, a joint nonprofit investigation reported that among seven sampled proxy networks, an average of 85% of connections were flagged as potentially fraud-related, with over 80% resolving to real residential addresses. In the US alone, an estimated 20 million or more IP connections flow into such pools annually. In underground forums, the demand for "clean" residential IPs has also intensified—it’s no longer just about whether it’s residential, but whether its history is clean and whether it’s been repeatedly blacklisted by financial sites.
These new insights have directly reshaped how legitimate business users select residential IPs. Previously, many teams were comfortable if an IP looked like home broadband. Now that detection thresholds have lowered, dirty flag ratios are public, and abusers are also cherry-picking, selection criteria for legitimate use cases must be more granular. Below, we break down the comparison dimensions to turn selection standards into actionable checkpoints.
Residential IP Cleanliness: Check Detection Signals First, Then Scale
Cleanliness is now the primary filter. The newly opened detection data emphasizes "direct observation" rather than ASN or hostname inference, including last_seen (the most recent date the IP appeared in a proxy network) and percent_days_seen (frequency of appearance during the observation period). On average, an IP is active in a proxy pool for only about 4.56 days; within 90 days, 60% of IPs are seen only once, and 46% appear in multiple provider networks. This means "once clean" quickly becomes dirty, making historical reputation alone insufficient.
In practice, when you obtain a batch of sample IPs, prioritize these signals: exclude IPs that appear frequently over the past 7 days; markings shared across multiple providers indicate higher risk; low-frequency IPs may actually be more suitable for low-frequency tasks. The 85% high flag rate in the DCA report and the underground’s clear distinction between "clean vs dirty" both remind us that pools reused repeatedly quickly accumulate negative reputation. Nexip routinely prioritizes low-sharing, short-exposure-cycle nodes during allocation, and users can also cross-validate using public detection APIs to reduce risk.
Source & Compliance: Ethical Recruitment Matters More Than Marketing Numbers
The second dimension is where the IPs come from. Reports repeatedly note that many residential connections are silently recruited through free apps, browser extensions, smart TV boxes, fake VPNs, or pre-installed malware—often without user knowledge. Bandwidth-sharing services have also been observed routing traffic to entities in sanctioned regions. If legitimate businesses unknowingly use such sources, they face higher risks of bans, compliance audits, and even liability.
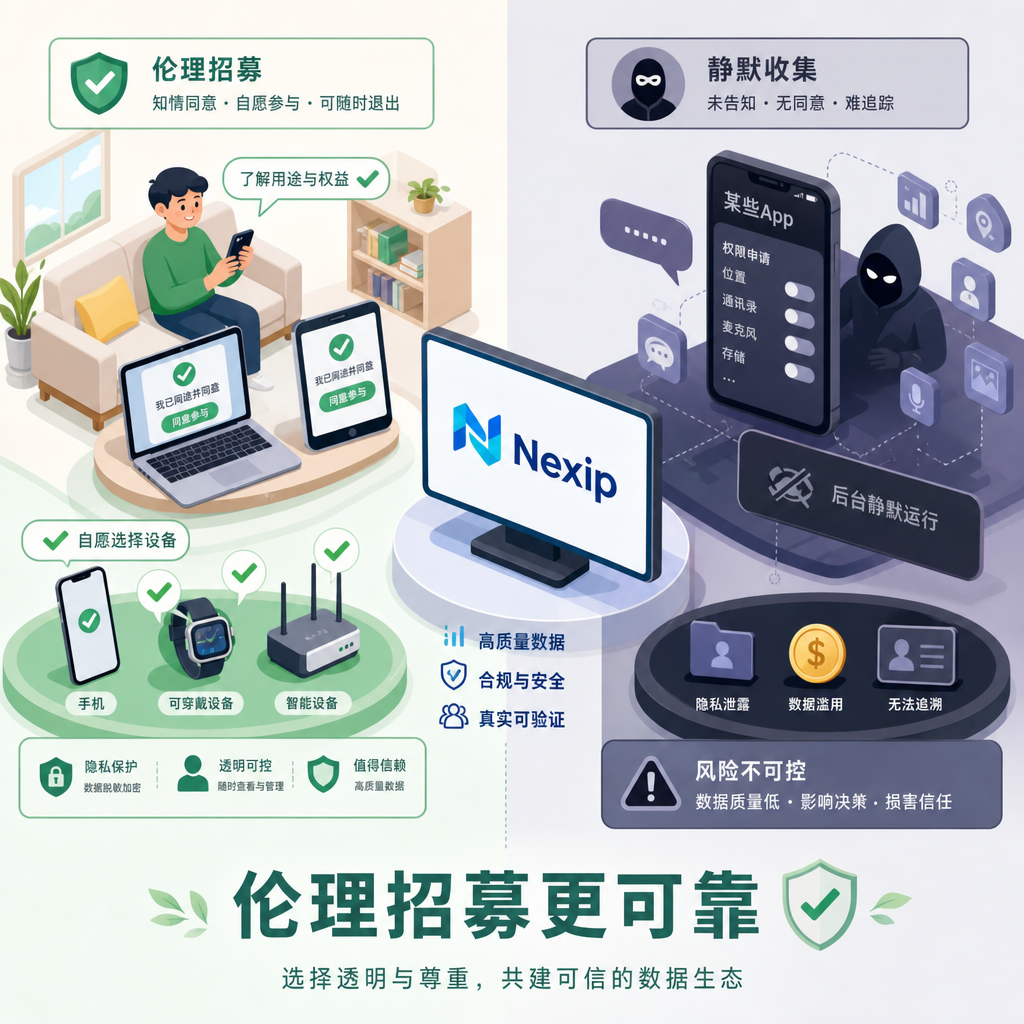
When comparing, ask three things: Is user consent explicit and ongoing disclosure maintained? Are known malicious SDKs or pre-infected devices excluded? Is there a verifiable opt-out mechanism? Simply claiming "native residential" or "millions of households" isn’t enough—you need to see actual recruitment paths and audit trails. The market is expanding (some analyses predict double-digit growth for rotating residential proxies for years), but enforcement and detection are also tightening, making ethical sources a differentiator.
Dynamics & Freshness: Rotation Speed Must Match Your Business Rhythm
The third dimension is the pool’s dynamic nature. Detection data shows IPs come and go frequently, with hundreds of thousands of changes daily. The top few providers hold nearly half the share while the long tail is fragmented. For tasks like price monitoring, ad verification, and public data aggregation, too-fast rotation can break sessions, while too-slow rotation risks getting flagged.
When selecting, compare:
- Configurable stickiness duration (minutes to tens of minutes)
- Fresh IP proportion and actual availability (not just total pool size)
- Geo-accuracy stability down to city or finer
- Latency and success rate fluctuations during peak hours
- Availability of real-time health check interfaces
These directly determine success rates. Underground forums already complain that "city-level isn't enough; we also need matching timezone, language, and billing zip code," indicating rising value for fine-grained locality combined with freshness. On the business side, using Nexip for session-level binding and external detection to check last_seen can quickly verify if nodes are still in the "clean window."
Multi-Provider Sharing & Isolation Risk: Avoid "One Falls, All Fall"
The fourth dimension is the degree of sharing. Nearly half of IPs appear in multiple networks, meaning if one pool is abused, other resellers or white-label services may also be affected. Detection now marks specific providers (including residential/mobile/datacenter suffixes) to facilitate isolation.
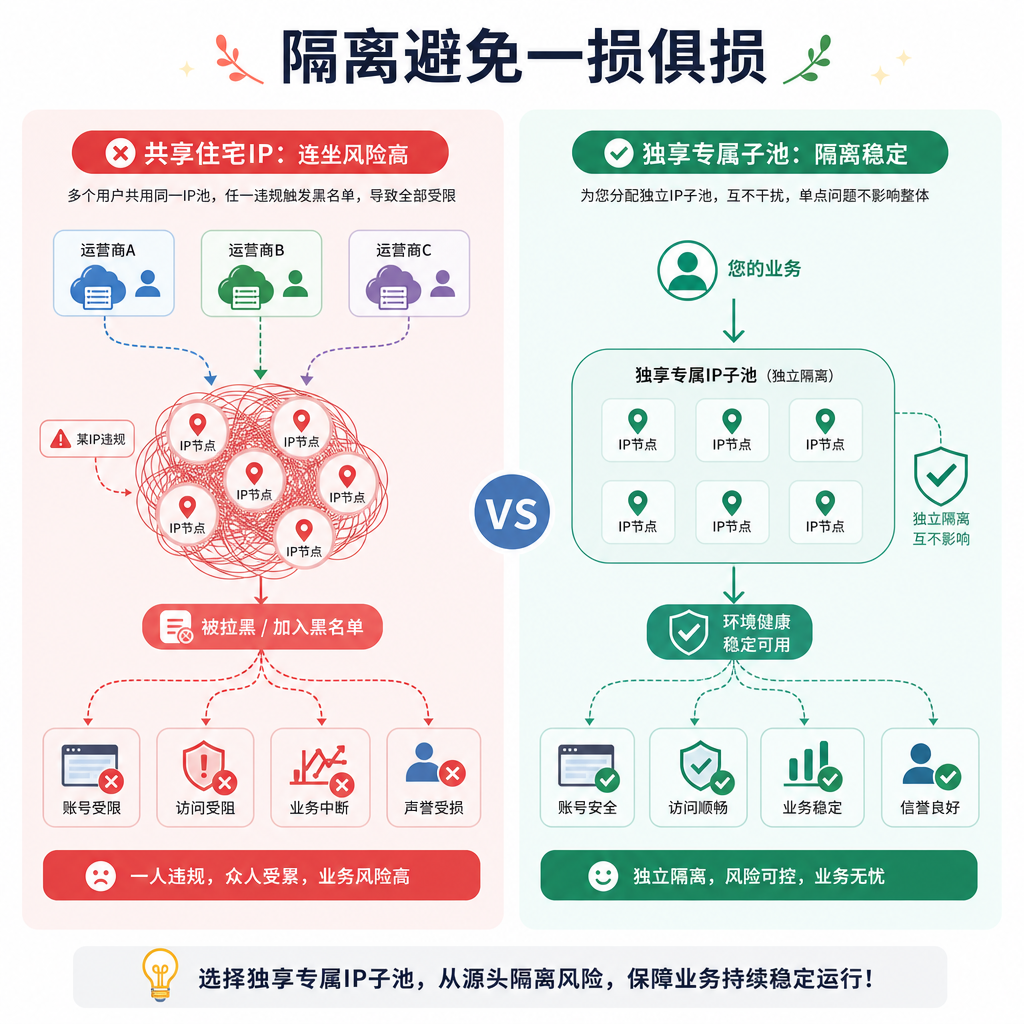
When comparing, focus on: Are there independent sub-pools or dedicated channel options? Are high-risk target site visits restricted (this may actually protect remaining nodes)? Is there deduplication for exit nodes? Higher sharing increases the probability of collective blacklisting. For multi-account or long-term tasks, prioritize low-sharing or explicitly isolated solutions over purely large pools.
Scenario Matching & Overall Identity Consistency: Proxy Is Just One Layer
The final dimension is scenario fit. Residential IP alone is no longer a universal pass. Underground analysis shows a stronger emphasis on binding IP, browser fingerprint, device profile, timezone, language, and behavioral rhythm into a complete identity. The same applies to legitimate use: e-commerce price scraping must match the target site’s region; ad verification needs to simulate real user timezones; account management requires session stickiness.
Simplify your selection checklist to:
- Target site’s historical tolerance for residential traffic
- Need for city-level or ASN-level targeting
- Session persistence requirements vs rotation frequency
- Compatibility with fingerprint browsers or automation frameworks
- Balance between cost and success rate (dirty pools seem cheap but cost more in retries and bans)
Scoring these five dimensions together is far more reliable than just looking at price or advertised pool size. The July wave of detection data and dirty flag disclosures essentially turned "invisible" risks into quantifiable comparison items.
Run current vendors through these criteria, and you’ll find that residential IPs truly suitable for long-term use often score well simultaneously on cleanliness signals, source transparency, and dynamic controllability—not maxed out on only one dimension. When testing next, start with small traffic to execute both detection and business success rate metrics before scaling up. That’s more effective than blindly switching pools.


Comments(0)